I’ve just sent out a question to the Windy team about the cloud cover data and gave them the link to this thread – maybe they like to comment here to clarify this (hope that’s ok, Peter).
Reply from the team:
Hello Patrick, thank You for your question.The cloud cover layer on Windy is diversed into three types: lowClouds, mediumClouds, highClouds (all in percentage %)
Our overall cloud cover is calculated as following: lowClouds + 0.5 * mediumClouds + 0.3 * highClouds. If the sum is higher than 100 , we “cut” it to 100.
Patrick wrote:
Reply from the team: Hello Patrick, thank You for your question.The cloud cover layer on Windy is diversed into three types: lowClouds, mediumClouds, highClouds (all in percentage %)
Well, that’s a non-reply. Proceed with caution.
Peter wrote:
If they offered skew-t plots, or cloud cross-sections, that would be a step forward. This has been a holy grail for so long – ever since some Swiss student (?) did the original meteoblue.com (which I talk about in my writeup linked above) as his PhD thesis but which was more pretty graphics than reality.
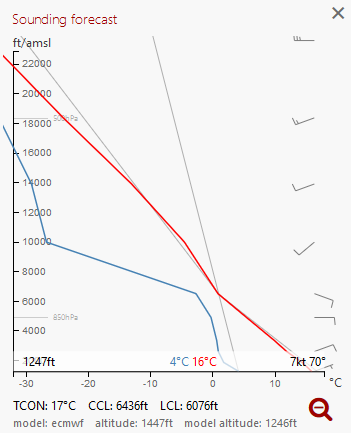
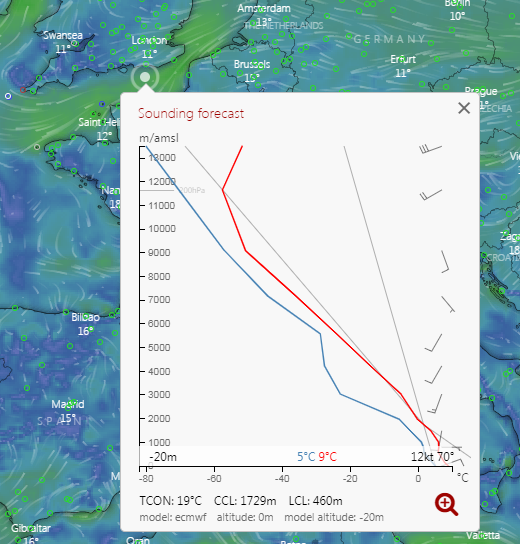
Windy now displays Skew-t diagrams:
How do you get that? I have just looked and can’t see it. They do some new stuff called Meteogram and Airgram…
Right-click on any place on rhe map and then the last option („Aerologie“ in German).
Windy is the best weather app IMHO.
WOW – brilliant!
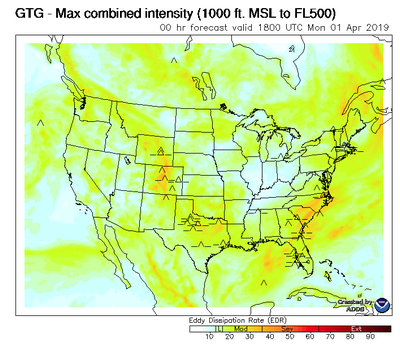
What is the advantage of Skew T? It is just based on the same computed weather models. Basically, the rules to interpret Skew T are already programmatically encoded in the weather forecast. For example, instead of figuring out weather there is wind shear at a certain altitude, I just look at the GTG product at https://aviationweather.gov/turbulence/gtg and get the same without trying to be a meteorologist, and likely not a good one, since not my core expertise, which is likely true for 99% of pilots.
A slight problem with the GTG is that is covers the wrong part of the earth’s surface, for European pilots
the rules to interpret Skew T are already programmatically encoded in the weather forecast.
That is true to the extent that tafs carry the info, but a lot of stuff they don’t carry. There is no temperature info, no cloud vertical extent info, etc.
Lucius wrote:
What is the advantage of Skew T?
AFAIK it is just a visualisation tool of raw data (a nice one actually) in the old days where you can’t have that much interactivity or ability to manipulate raw data, I think the vertical profile of processed data (e.g. just clouds) on windy does it for me now, I stopped looking at raw data while ago  (e.g. CFD data, dew/temp)
FYI, Getting SkewT on windy is like plugging a GPS track into CDI and flying on VOR while GTN is switched off (sorry Peter I could not resist with this one )