I’ve just done a couple of flights (EGKA-EDNY and back) and the return one in particular – today – I would have never done had I used not only the old tools e.g. MSLP charts but also some newer ones e.g. the Autorouter “GRAMET”.
This was the general situation
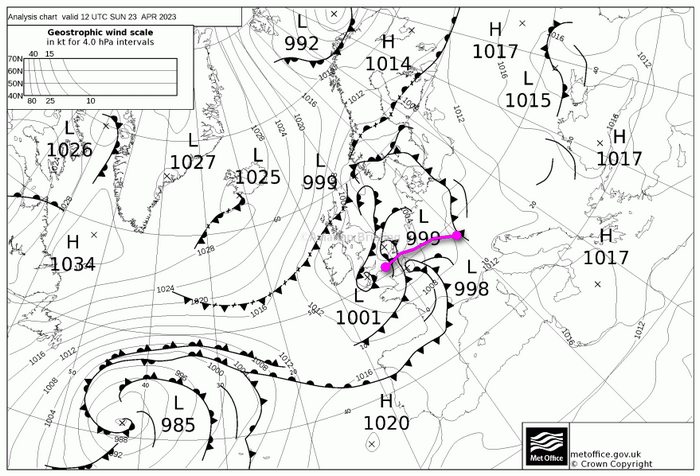
In the past, I would have taken one look at this mess of occluded fronts and not bothered.
I will post the rest in subsequent posts because for obscure reasons threads with a large 1st post can’t be referenced on the home page.
Great stuff. Did you film any of your flights ?
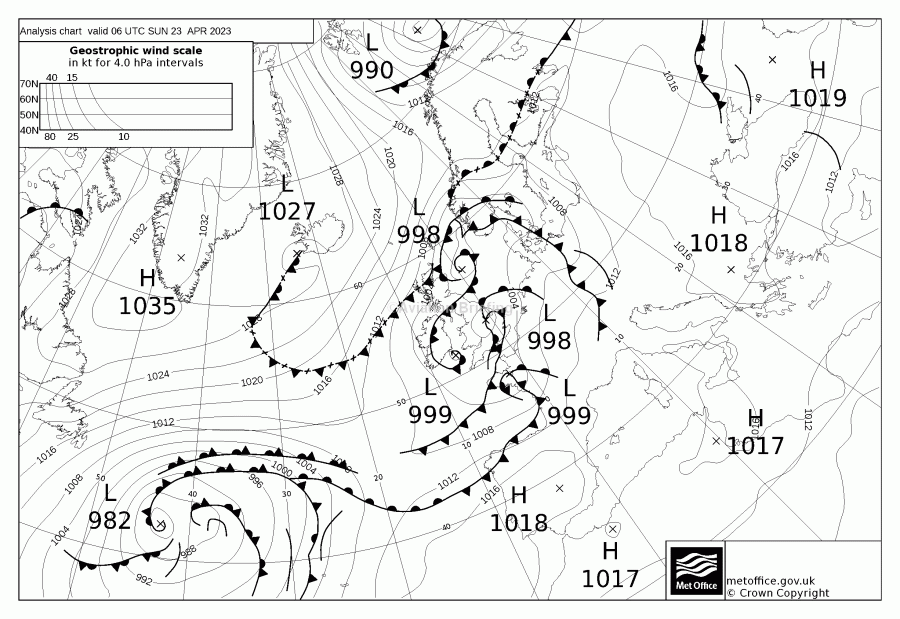
The 0600 MSLP wasn’t much better
My normal strategy is to fly VMC on top whenever possible. The aircraft will go to FL180-200 on a reasonably cold day but you can also get really strong headwinds that high, plus it takes a fair whole to get there. And in any convective conditions you need to go much higher.
I did a couple of writeups on the “VMC on top” quest here and here. These show the history of the topic and some of the truly crappy tools we used to have, in the bad old days of the European met offices keeping their data “top secret”, and before windy.com started delivering the ECMWF model. None of it stopped people producing websites with pretty but largely fictitious graphics, and I would put the GFS data in that category. Consequently the Autorouter GRAMET is in the same category: mostly fiction.
This flight was examined using windy.com and several layers were used. The most relevant layers for GA are
The last one has been a long quest for the 22 years I’ve been flying although – due to European airspace and its management – it comes into focus only when you get an IR and can climb high enough!
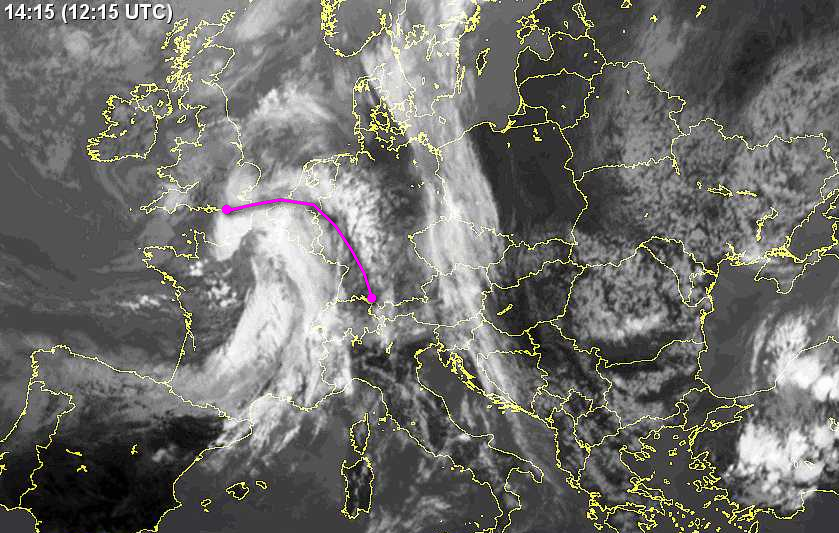
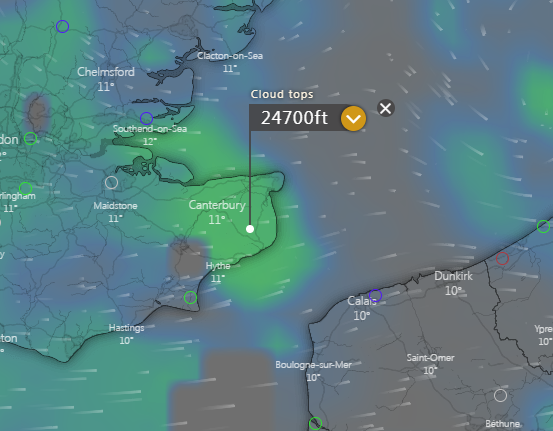
The problem is that Cloud Tops shows it literally: if you have a cirrus layer at FL350 that will show as that. Same with the IR images – this example shows a load of white which is basically FL300+
so one needs to bring something else into it. The simplest way is to use Cloud Tops together with Medium Cloud. And here’s a good example
Cloud Tops (look at “Canterbury”)
Medium Cloud
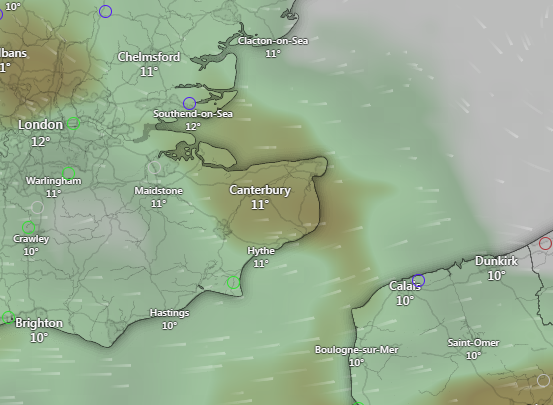
Right where Windy shows tops of 25k there is actually no Medium Cloud.
With the old IR images, there wasn’t a similar “medium cloud” reference layer. The nearest was a radar (some random Meteox one in this case) image e.g.
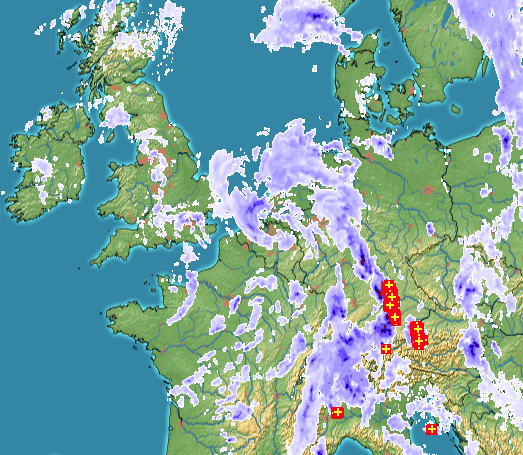
and where this shows a lot of dense muck, but the IR image shows little, it is probably OK to fly provided the above Meteox image doesn’t show lightning.
The forecast heights are never accurate and probably never will be, so the foregoing needs to be seen on the context of a typical oxygen equipped IR tourer which can do FL100 or FL150 as required. We simply do not have a way to forecast whether tops will be FL100 or FL110.
Windy.com still suffers from “thin cloud” (the kind which sun shines through pretty well, and which rarely produces ice) not being depicted. For example this
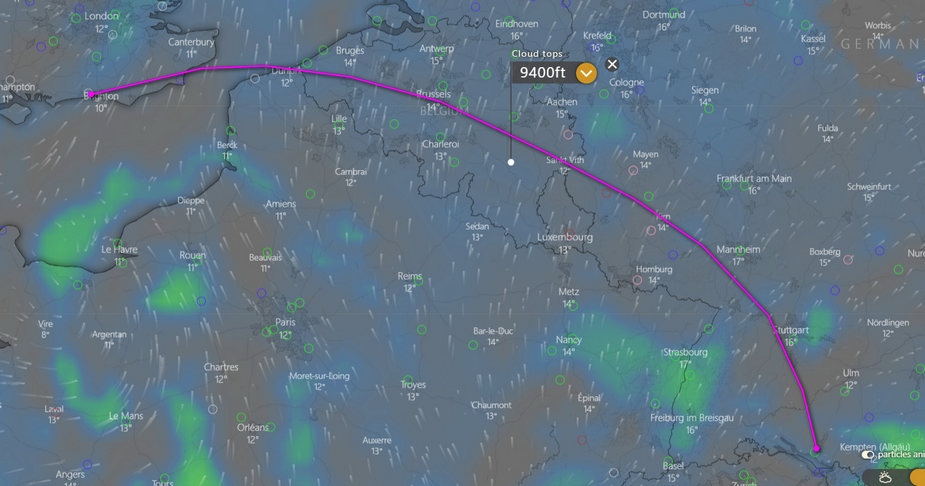
was relatively accurate except for the thin cloud above, extending maybe another 5000ft. And it did produce ice, eventually… enough to do this experiment 
Note also the above cloud tops image was for a specific time and would not have showed them evolving along the 4hr flight, That is what a GRAMET (the name originally comes from the Univ of Granada running a website doing this) is supposed to show but we don’t have a source of GRAMETs from the ECMWF model. And cloud tops do evolve as the day advances! One normally starts a flight at the earliest possible time (least convective activity) and the stuff then grows at some tens of ft per minute as the day warms up.
Did you film any of your flights ?
I thought about it this time but didn’t because a) most of the two flights were expected to be above cloud (and indeed on the outbound I saw nothing between Dover and breaking out on the EDNY ILS) and b) the mp3 recorder has gone AWOL so there would be no audio
I will post some pics etc in the 2023 EDNY thread.
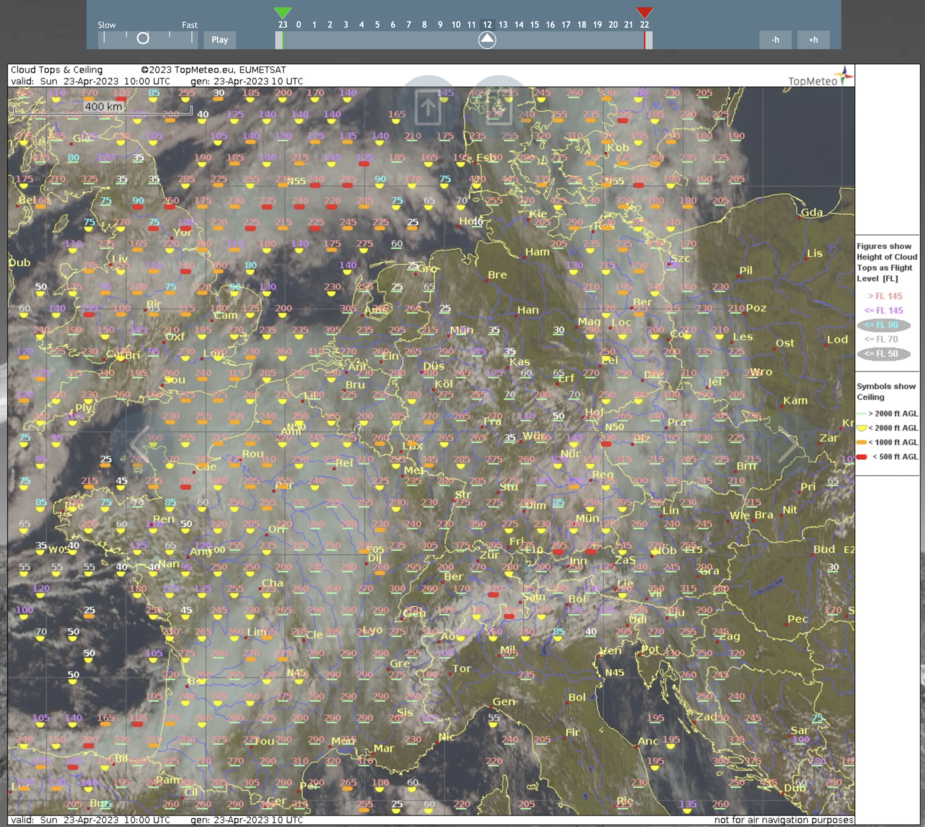
Have you seen this @Peter? It’s TopMeteo, which is a payable service. The data is available with a 5/15/30/60’ granularity. As can be seen, this screenshot is for 1000Z today. It shows cloud tops and ceiling. Unfortunately, it is from Sat/Radar and is therefore not a forecast. But one can step through the past to get an idea where things are headed.
I think one needs a forecast.
If one was OK with previous data, the 0000Z and 1200Z baloon ascent data is totally wonderfully accurate. Most of European ascents are visible at the Univ of Wyoming skew-t site (mentioned in my two web articles). These remain a handy tool for stable wx, however.
What I find especially useful on Windy is the sounding forecast for any particular location. Now sounding is typically actual environment data gathered by radiosondes and not a forecast and you can see that on Windy too but they also have sounding forecast based on the ECMWF model and other models for any location you want and it looks like this:
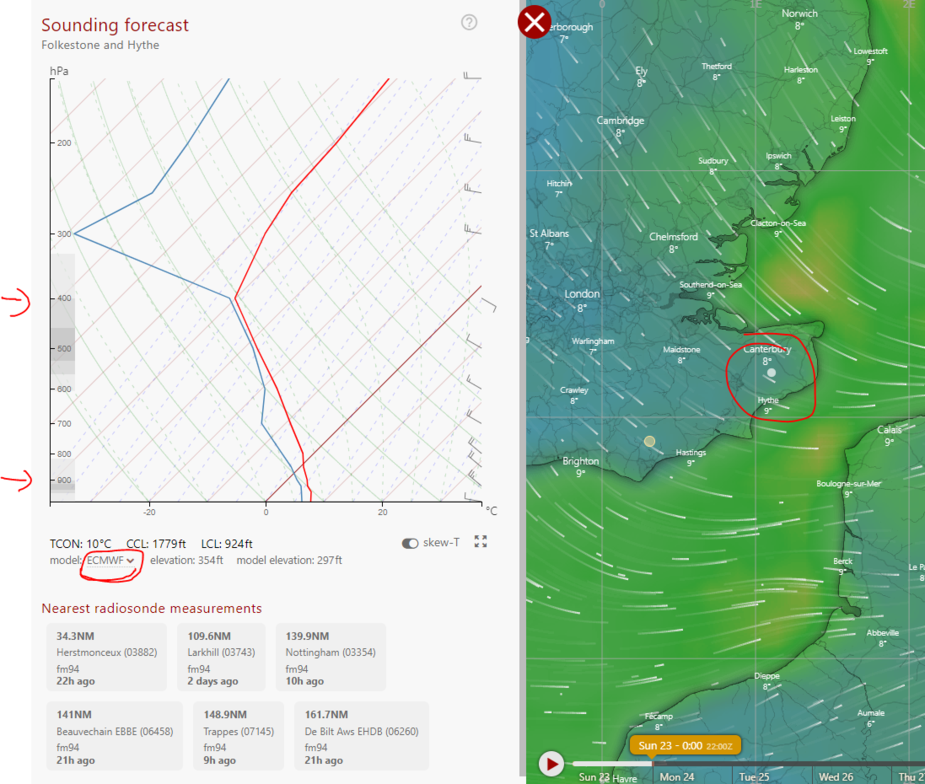
Just right click any location and then click sounding (long press in the app). As you can see on the left side you can see where you can expect visible moisture and you can verify that if you look at the spread on the graph. If you move the pointer up and down the graph it’ll draw a line across and give you the numbers for altitude, dew temp, temp and wind direction and speed.
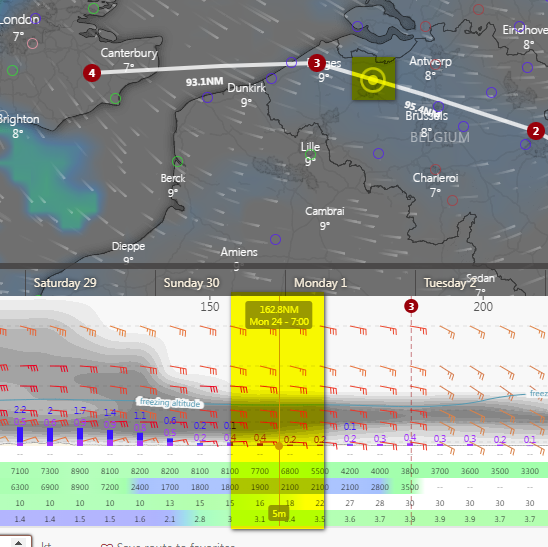
And if you use the Windy distance measuring tool (also right click or long press in the app), you can get a meteogram forecast for your entire flight which looks like this:
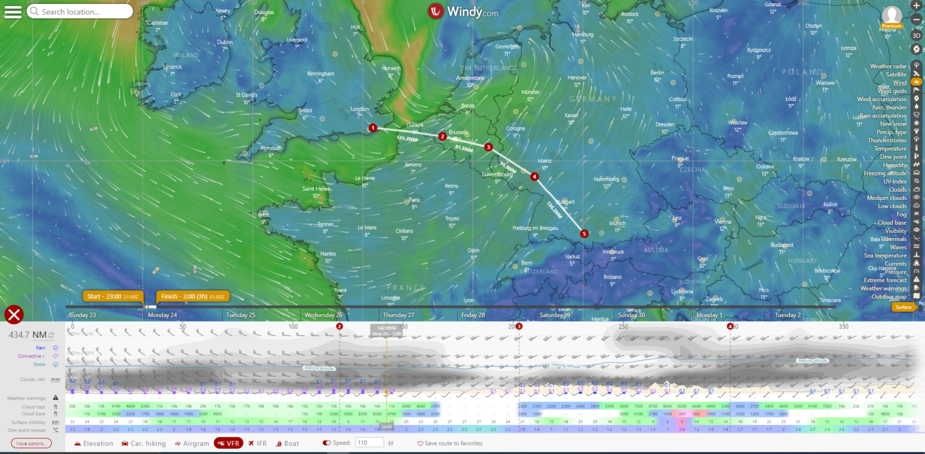
You have to click VFR at the bottom and put in your planned TAS.
Yes – a good trick which I forgot. There is something else though: you also have to move the slider on the bottom to get the map to show the data
This was discussed in the original Windy thread but it can be a struggle to get this working on a phone. For example (I have the paid app) I cannot find a way to get the altitude selector e.g. to see winds at different altitudes. Much better on a PC but still not always. I posted that here.
Neat.
On my iPad I can make the legs and distances appear with a long press but cannot get the cross section with clouds/wind barbs, etc.
How do you do this?