The Gramet showed clouds Fl 100 -Fl150 with snow coming out without showing any ice in those clouds. The clouds lower down do show Mod Ice. Hope Im reading that right. If I am I will wager that those clouds between FL100-150 are filled with ice which is what Prog chart showed. So as far as the Gramet is concerned how do they forecast Ice?
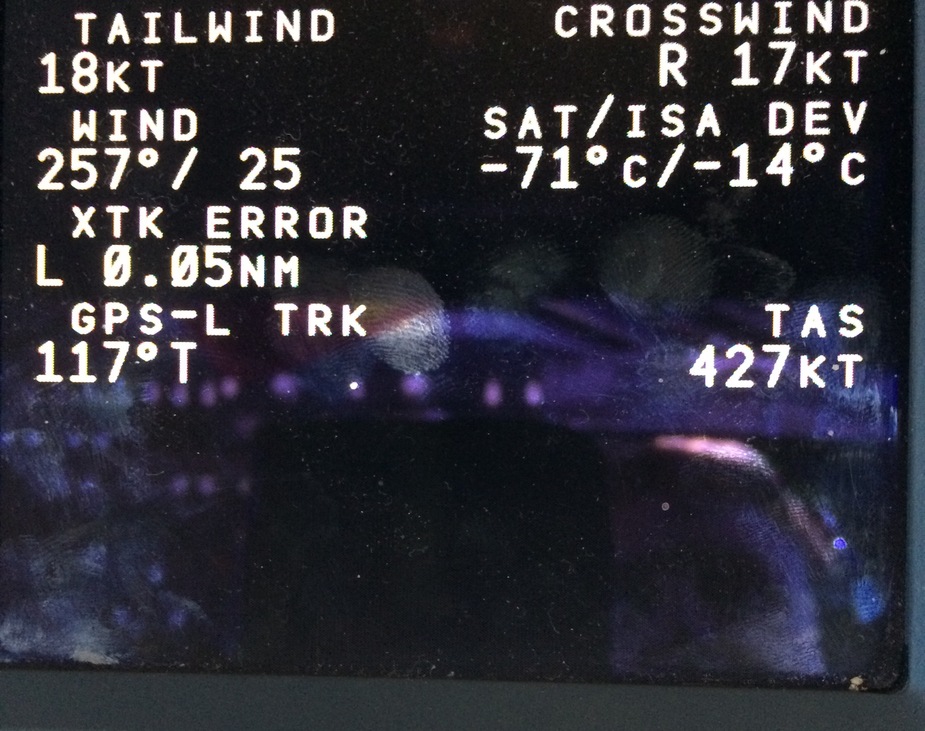
The high weather has been very unusual over the past few days. Significant icing in the high teens and exceptionally low temperatures in the 300s below the minimum operating temperature of many aircraft. Apparently a double tropopause, with around -74°C at FL370 and the “true” tropopause around FL490!
This picture was taken at FL350 on Monday morning. Coldest I’ve ever seen, and within 2° of the aircraft limit of -73°C
Peter wrote:
where do you get that cloud tops chart?
http://topmeteo.de/weather/aircraft!charts
It is under Aircraft → Charts → Current day → Cloud tops and ceiling
But you have to pay. I find that it is worth the money.
It is not a forecast, but a satellite observation. In the top left corner, they state EUMETSAT as source. I know they have been doing quite some research on how to correctly deduct cloud tops from satellite imagery, so I would expect them to do it as accurately as anyone can currently do it. Unfortunately, this product is the only one that lacks a detailed description on the Topmeteo site, probably because it is still new. But I have found them to be very responsive on other occasions, so if you drop them an e-mail I am sure they will be happy to provide more detail on that product.
BA038 apparently saw -80C or colder, over China, which (together with some other holes in the cheese e.g. a long low power descent) was why that design issue had not surfaced earlier.
Many thanks Rwy20. I do realise these are real IR images (and all come from EUMETSAT) but it is the temperature annotation which requires forecast temps aloft because the actual temps aloft are not available (well, not openly). They could come from airliner ADS-B emissions but AFAIK that data is not routinely collected. Also it would not yield data below ~ FL300 except around major airport terminal areas. Fortunately the temps aloft forecast from e.g. GFS is pretty reasonable.
Peter wrote:
They could come from airliner ADS-B emissions but AFAIK that data is not routinely collected.
Not from ADS-B broadcasts, but the data comes from airliners, and it is routinely collected (over ACARS).
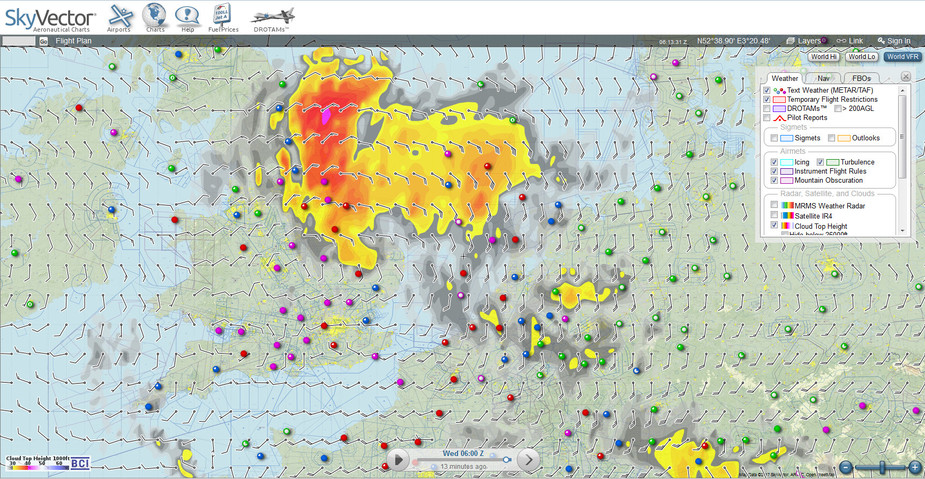
I don’t recall when but recently SkyVector started including Cloud Tops estimates in the weather display.
A good find, Petakas.
It would be interesting to compare the image with the SAT24 cloud top image.
The key Q is whether they just back-calculate the tops from the temperature and the ISA profile, or whether they use GFS-forecast temperatures aloft to do it. Using ISA under-estimates the tops in the summer – by say 5000ft if the conditions are ISA+10.
I have never seen a site which does it correctly.
Thanks for this website Petakas, I had not seen it yet.
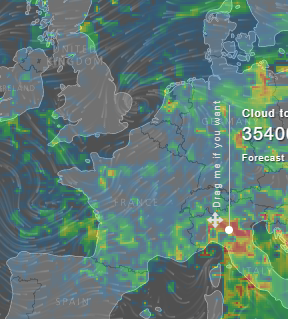
www.windy.com also seems to do it
The skyvector color scale starts at FL300 though, and no word on the greyscales. So only mildly useful at this stage.
I posted on the forum to ask for a finer scale down low.