None of those images show actual cloud tops.
Skew-T show the tops at the (very few) locations around Europe where the baloons are launched, and only at 0000Z and 1200Z.
Windy has a “Cloud Tops” layer available, not sure how accurate though, but covers up to FL500. Should be enough for most EuroGA users 
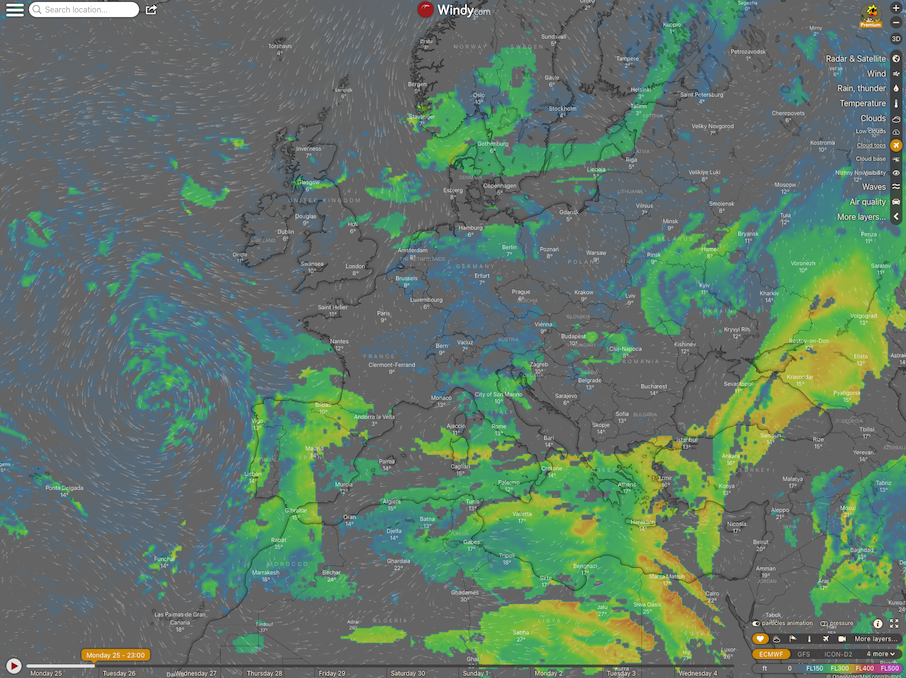
That is computer generated from the wx model data. Not actual tops.
I think it’s very hard data to get, I wonder how one can lively correct Windy/T-Skew/IR using initial OAT profile from an actual flight? can one measure dew point during the flight?
Once you get into IMC, the tops are usually 4kft above where you think they are and 2kft above where your engine think he needs a break
IR image corrected for actual or forecast temperature profile. See discussion further back.
Free of charge you can only look at it the next day but this is the image for yesterday from topmeteo:
That’s a new one, but I struggle to interpret it. For example the bit circled was definitely more than FL80. Probably FL180.

Sebastian_G wrote:
Free of charge you can only look at it the next day but this is the image for yesterday from topmeteo:
Thanks, that would be good for back-testing
Peter wrote:
For example the bit circled was definitely more than FL80
The bits 50nm around it seems in FL160-FL180?