dublinpilot wrote:
are you referring to the UK Met office MSLP charts or to some other publisher’s charts?
I’m referring to the UK Met office MSLP charts. Wait until summer and you will see (France, Germany)
I saw one on the UK Met a few years ago, and found on the site what it was. When these latest ones appeared, I’d forgotten, and couldn’t find the symbol in the UK site. I gave up until this thread re-educated me.
Karl_Acht wrote:
These lines are not seldom.
When you say that, are you referring to the UK Met office MSLP charts or to some other publisher’s charts? I ask as I’ve not seen them on the UK MO MSLP charts, and I use them regularly. But I could well imagine that some other met office regularly publishes charts with them shown.
These lines are not seldom. But mostly you see them during the summer time, and then often preceeding cold fronts. These are classical conv.lines.
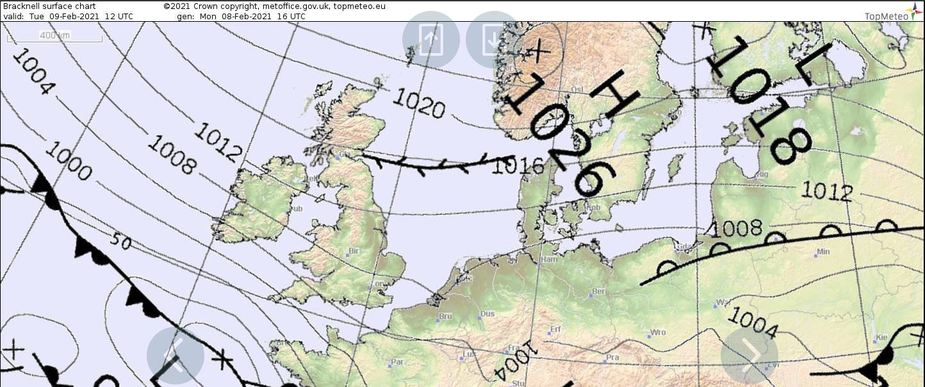
The lines over the North Sea few days ago are more or less cloud streets. They are induced by very cold air flowing first over the Baltic Sea and then the N.S. And some of the streets develop into shower lines (convergence at the surface, divergence at altitude). You have the moisture and the energy over the water. The pronounced line in the above picture is probably further enhanced by orographic influence – Denmark, Norway. The flow is accelarated over the skagerrak (less friction) which in turn leads to more energy exchange making bigger shower lines. My theory…
I’m still puzzled by these lines on the recent charts.
These symbols are almost parallel to the isobars. Wind is said to flow along the isobars.
Why convergence along these lines, but not elsewhere? It’s mainly over sea. Is there a marked temperature change in the sea at that point? If so why does the line move, much faster than sea water can move?
Convergence lines are zones where two wind systems converge head on. They produce a significant amount of cloud and may produce quite a bit of precipitation. The main difference to a front is that the latter moves while a convergence line is mostly stationary for a while.
What would you expect? Quite a lot of convective cloud with associated showers and thunderstorms.
It is basically the small scale version of the biggest convergence zone in the world: The intertropical convergence zone which is probably the most active semi-stationary weather system in existence.
A nice brief about them from your very own Met Office.
I had no idea what those symbols were, and probably had never seen them before.
The convergence line is generated above the rel. warm North Sea producing snow showers

We need to do another Zoom quiz. The last one was great fun!
Now that the correct answers have been given, I can be a smart Alec and say here be dragons! ;)