Diamonds are incredibly benign aerodynamically.
During my test on DA20, I did not managed to fully stall despite a fully aft stick for several seconds. I did it a lot in the sim, which results in dropped wing and spin, but on the actual aircraft nothing happens (you’re stuck at 500fpm descent). I had done it before but it did not strike me as much as this time.
This plus the fact that you can reach down to 40kt (slightly more on the DA40 depending on mass, but still really low) makes for very forgiving aircrafts.
UdoR wrote:
how the aviation consumer magazine got the flight hours of aircraft?
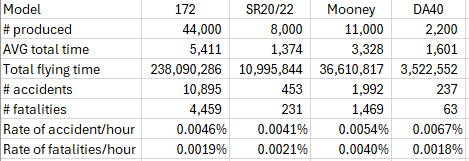
GA flight time is estimated in the USA by using data from an annual aircraft activity survey conducted by the FAA, the General Aviation and Part 135 Activity Survey.
Being fully aware of the low significance of accident data in EASA’s annual safety review lacking utilization data, EASA has been trying to do a similar effort using the GAMA/AOPA survey, but the amount of data is too scarce to break down by aircraft type.
In the past, for total EU utilization data, I used Avgas fuel usage as a proxy, with my reports showing a decrease in GA safety with the advent of EASA. THis proved to be non-PC and I did not push it further once EASA’s GA roadmap started heading the right way. Avgas usage is an increasingly less significant number with the multitude of fuels being used in GA. BTW this multitude of fuels is absolutely crazy given the low overall utilization: I for one would advocate for a single- (and thus cheaper on average) aviation petrol. In any case, this measure again disallows a breakdown by AC type.
Hence the best proxy of total historical utilization by type that I can think of is number of aircraft-years-since-production. This is not great but better than nothing. The numbers should of course factor that not all types are utilized equally on average.
Now, if the resulting rates are very similar, this difference in utilization by type is very relevant making my proposed comparison bland.
However, when the resulting rates by type vary from 0.3 to 2.6 , do you still think it means little or nothing?
In France AFAIK we do not do accidents by type. Instead we do accidents by the stage of flight in which the accident happens ie take off, climb, cruise, landing etc.
I’m not sure how much accidents by type tells us. It can frighten us if we are thinking of buying a particular type or model.
But sometimes the aircraft is perfectly good but it’s the situation the pilot puts it in which is more important. But even then?
You could look eg at how many PA28s have crashed due to icing. I don’t know the answer, but let’s say it’s once a year. What does that tell us. a) That a PA28 is unsafe if there is icing around? b) that an AD should be issued to have all PA28s fitted with anti or de icing equipment c) PA28 pilots should learn how to read weather forecasts better or d) pilots should recognise when icing is occurring and get out of it quick?
I refer you back to the MCR4S which possibly led to this discussion.
Out of the 21 accidents and 17 fatalities I have so far managed to find 3 write ups (I admit I haven’t spent a lot of time on it)
Out of those 3 accidents 1 was take off in 49°C OAT with a loss of power after take off and the pilot trying to return to the runway.
4 out of the 17 fatalities resulted.
The other 2 accidents were both attributed to poor or incorrect maintenance or inspection of the flap mechanism or failure to notice it during the pre flight although its inspection is in the POH. One of the aircraft landed without injury but aircraft damage. The other crashed with one fatality. The design of the flap mechanism has now been changed.
gallois wrote:
we do not do accidents by type
AFAIK only Aviation Consumer does. And yes this data has to be read with a certain level of judgement, it is not a simple matter of “which aircraft is safest”
Oftentimes, as you say it is a matter of identifying which type-related aspects drive accidents and implementing corrective or mitigating actions (AD’s , flap mod on MCR4s , POH/AFM’s/SOP’s…)
If you don’t choose your type based on these statistics, accidents by type are very relevant.
Putting aside small sample variance, accidents by type tell you as much about the aircraft as the pilot and mission profile, which is very statistically significant (IF you don’t choose your type based on these numbers).
The numbers tell you that if you happen to fly this type, you have a xxx probability of accident (of course you could take many more factors into account because it’s still a very coarse estimation, but one factor is better than no detail at all).
And they also may give an indication about the aircraft itself. No certainty, but still an indication. There are so many known weaknesses that lead to incidents / accidents that it’s very sensible to think that airframes have an impact on accident rates (be it just for the impact of speed). Examples include twins that tend to spin during exercises, nose-heavy aircrafts that lead to hard and bounced landings, etc.
I have to admit I wonder about those numbers.
Some of the airframes which have horrible numbers have not been known as “death traps” or “Doctor Killers” throughout their service, yet they have horriffic fatality rates while accidents by serial number are very low. IE the TB20 has a fatality rate of 69% (if I read this right, 69% of the reported accidents are fatal) and the M20x had 74% of reported accidents include fatalities? At the same time, Accidents per SN are quite low for both of those, while accidents per SN (would that mean that x% of the fleet was involved in accidents?) is comparatively low.
The other question is how reliable the data of ASN are and how many accidents are reported vs actual numbers. I would suggest that particularly the fataliy rate might be massively increased over the actual accidents having taken place if accidents are not included in the ASN DB.
Mooney_Driver wrote:
IE the TB20 has a fatality rate of 69% (if I read this right, 69% of the reported accidents are fatal)
No, sorry I did not make that more clear: this only means that in 100 TB20 accidents there are 69 people dead (ie 69 fatalities).
Hence the suggestion to correct or divide by number of seats since a six seater is bound to fly with a higher number of POB than a four seater. If you do not do that, a 747 would be found to have a much much higher fatality rate than a TB20, (1666 fatalities for 158 accidents or 1054% fatality rate for 747-200 in ASN) which would be misleading. Dividing by 300/4 seats will result in 14% for 747-200 vs 69% for the TB20 which makes much more sense.
Our Jodel Syndicate started in 1984. There were 2 accidents before I joined in January 1990.
There were 3 accidents by 1999.
There were no more accidents until we sold the DR1050 in late 2020.
Result of increased experience of type in the Syndicate?
Could a good proxy for aircraft utilization be to crawl aircraft listings and extract total time?
Summing up the total time for each model listed for sale would give the total flying hours of that “fleet”.