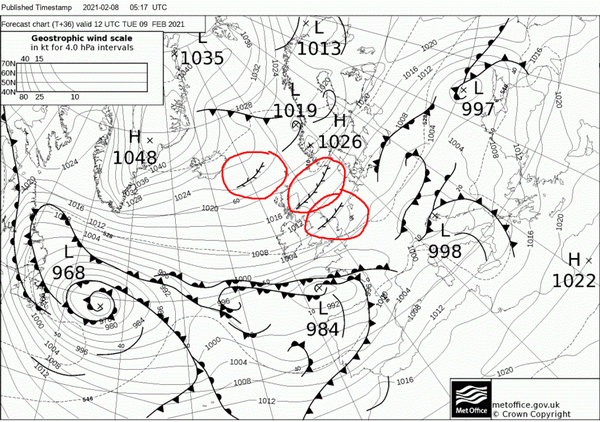
What are the symbols outlined in red on this chart? I’ve not seen them before on these charts.
What type of weather are they predicting?
Ah…Found it.
Here is the answer for anyone else who is interested:
Convergence line
A slow-moving trough, which is often parallel to the isobars and tends to be persistent over many hours. They are quite common in cold northerly outbreaks down the Irish Sea, affecting west Wales, Devon and Cornwall in particular, but can be found in other areas also. This convergence line can give hours of persistent precipitation over very localised areas, whilst a few miles down the road it is relatively dry, leading to some heavy snowfall/rainfall. In summer the convergence lines are not as easy to forecast, but then can still occur due to sea-breeze convergence, and are over the land, whilst in winter they are over the sea.
You can expect CBs along a convergence line.
dublinpilot wrote:
What type of weather are they predicting?
I would say convective & lift clouds over the sea, but looking at Windy & RASP layers it does not seem they have anything fancy assocaited with them, the whole middle of the MSLP chart is empty, so I imagine it’s tempting for UK MET office to add stuff 
Now that the correct answers have been given, I can be a smart Alec and say here be dragons! ;)
We need to do another Zoom quiz. The last one was great fun!
The convergence line is generated above the rel. warm North Sea producing snow showers

I had no idea what those symbols were, and probably had never seen them before.
Convergence lines are zones where two wind systems converge head on. They produce a significant amount of cloud and may produce quite a bit of precipitation. The main difference to a front is that the latter moves while a convergence line is mostly stationary for a while.
What would you expect? Quite a lot of convective cloud with associated showers and thunderstorms.
It is basically the small scale version of the biggest convergence zone in the world: The intertropical convergence zone which is probably the most active semi-stationary weather system in existence.
A nice brief about them from your very own Met Office.
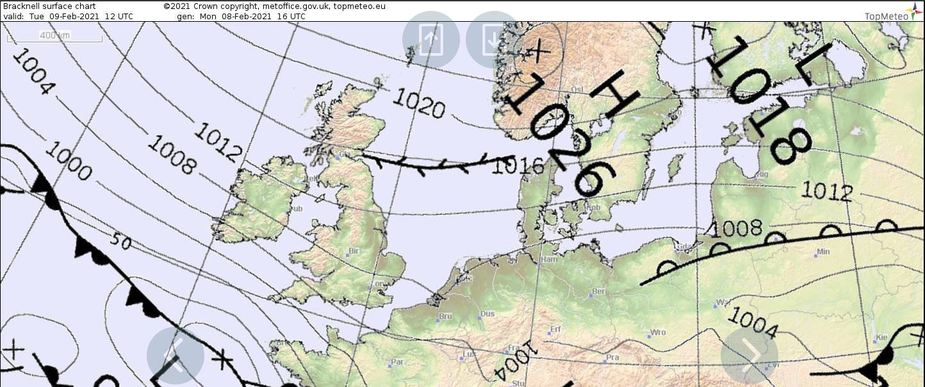
I’m still puzzled by these lines on the recent charts.
These symbols are almost parallel to the isobars. Wind is said to flow along the isobars.
Why convergence along these lines, but not elsewhere? It’s mainly over sea. Is there a marked temperature change in the sea at that point? If so why does the line move, much faster than sea water can move?